Summary
A step-by-step guide on how to collect a Debug Log for StellarEnforce (SPLM) Performance Issues. This can be achieved in two ways:
- Generate a Performance Report with StellarEnforce
- Set Up Windows Performance Recorder and Generate a Log
Applicable Version
StellarEnforce 1.0 - 1.3
Details
Generate a Performance Report with StellarEnforce
- Stop StellarEnforce service. (Slcmd.exe stop service)
- Create a registry value as follows:
HKEY_LOCAL_MACHINE\SOFTWARE\TrendMicro\SafeLock\2\DebugLog
“EnableProfiling”=dword:00000001
- Start StellarEnforce service. (Slcmd.exe start service)
- Perform some tasks related to the issue.
- Stop StellarEnforce service. (Slcmd.exe stop service)
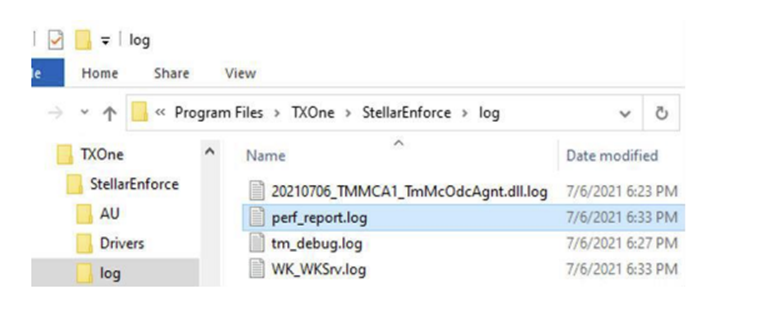
- Find the file perf_report.logat <wk_installed_folder>\log.

You don't need to enable debug logging to generate this report. In fact, it's advisable to disable debug logging while measuring performance.
Setting Up Windows Performance Recorder and Generating a Log
- Microsoft provides a tool called Windows Performance Recorder (WPR) that can record all activities on Windows.
- It is a part of the Windows Performance Toolkit, which is included in the Windows Assessment and Deployment Kit.
- If you are running a 64-bit OS, add the following registry setting and then reboot:
HKEY_LOCAL_MACHINE\SYSTEM\CurrentControlSet\Control\Session Manager\M
“DisablePagingExecutive”=DWORD:1
Setting Up Windows Performance Recorder: Windows 8 and Later
Preparation
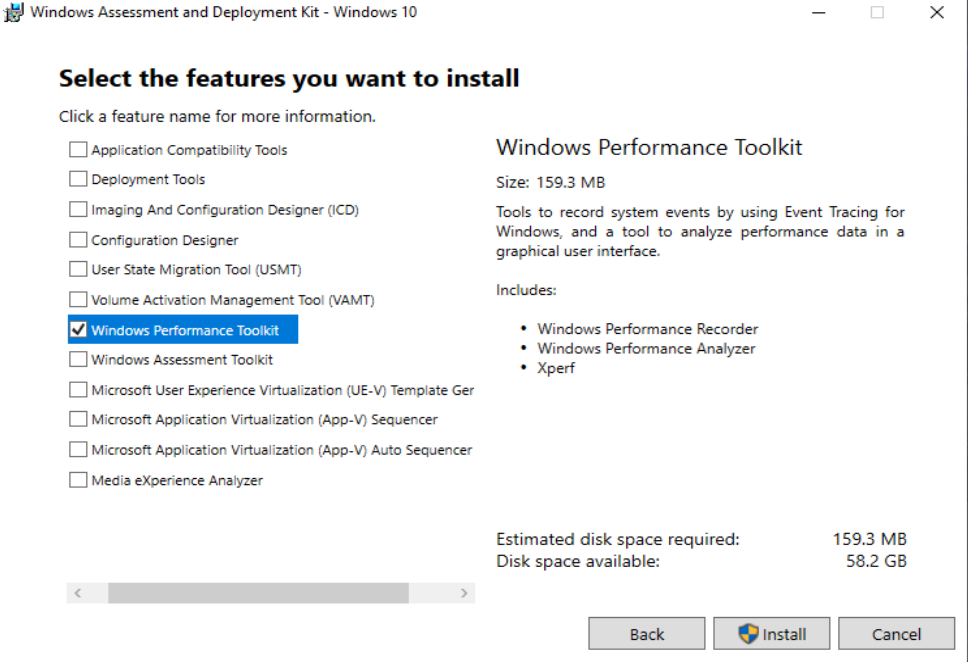
- Download Windows ADK for Windows 10.
- Select only Windows Performance Toolkit during the installation process.

Setting Up Windows Performance Recorder: Windows 7 and 2008 R2
Preparation
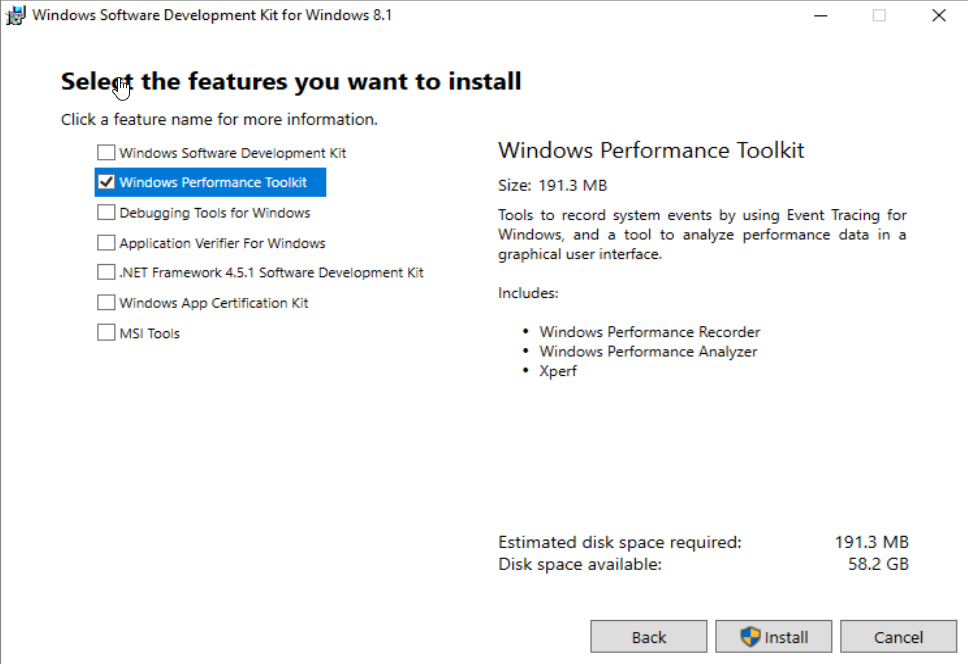
- Download Windows ADK for Windows 8.
- Select only Windows Performance Toolkit during the installation process.

Recording Procedure for > Vista
- Launch Windows Performance Recorder from the Start menu.
- Under More options, select the following items:
• CPU usage
• Disk I/O activity
• File I/O activity
• Registry I/O activity
• Networking I/O activity
• Heap usage
• Pool usage - Change the Logging mode to File.
- Click Start.
- Execute the application(s) or task(s) that are related to the issue being reproduced.
- After the issue has been reproduced, click Save.
- Click Browse, specify the desired location for saved logs, then click Save.
- Click Open Folder to get your ETL file, then compress it .
Setting Up Windows Performance Toolkit 4.x: Windows Vista, Windows 2008, Windows 2003 SP1, and Windows XP SP2
Preparation
- Request Windows Performance Toolkit 4.x from TXOne Networks.
- If you are running a 64-bit OS, add the following registry setting and then reboot:
HKEY_LOCAL_MACHINE\SYSTEM\CurrentControlSet\Control\Session Manager\M
“DisablePagingExecutive”=DWORD:1
Recording Procedure for > Vista
[Start]
xperf -stop -d nul
xperf -on base+cswitch+dispatcher -stackwalk cswitch+profile+readythread -MinBuffers 128 -MaxBuffers 640 -BufferSize 1024

[Stop]
xperf -stop -d system.etl
Collect the system.etl .
For further assistance, please contact us at support@txone.com or your support provider.